
Looking for more information about UI Automation? Check out my new book, published through the Pragmatic Programmers. Thanks for your support!
Since iOS 5 and Xcode 4.2 came out, I’ve been poking around in UI Automation and I’m starting to get impressed. You’ll want to read through the parts of my tutorial first. I assume you’ve already walked through those steps.
First off, they now let you invoke it from the terminal! Well…sort of. Observe:
instruments \
    -t /Developer/Platforms/iPhoneOS.platform/Developer/Library/Instruments/PlugIns/AutomationInstrument.bundle/Contents/Resources/Automation.tracetemplate \
    /path/to/your/application \
    -e UIASCRIPT /path/to/your/javascript/file.js
I broke up the command parameters on separate lines for some sanity. That first
parameter, -t [template file], lets you specify the specific template file
you want to use when instruments is run. You can run any kind of instrument you
want, but in this case I’m using the unbelievably long path to the default
Automation template that is offered by the new document wizard. You could make
your own template from within Instruments and specify that instead, but you get
the idea.1
and xcodebuild from the terminal, soon. I have a couple of tricks up my
sleeve to make them play better with Unix, but I’m testing a few things out,
first.
The second parameter is the path to the application binary that the simulator
uses. You can find them by poking around in ~/Library/Application
Support/iPhone Simulator/5.0. You’ll see a list of directories with guids for
names. Look inside them to find the app bundle you are looking for and that’s
the path you hand in here.
The last parameter is where you specify environment variables that are handed
in to Instruments. In this case we set the environment variable UIASCRIPT to
a path of a javascript file. That file will be executed and the output will be
sent to standard out.
You can also specify other environment variables with subsequent -e
arguments. These environment variables pass through to the application so you
can have, say, a RESET_ALL_DATA variable that your application checks for to
set itself up in a consistent state before the script is run.2
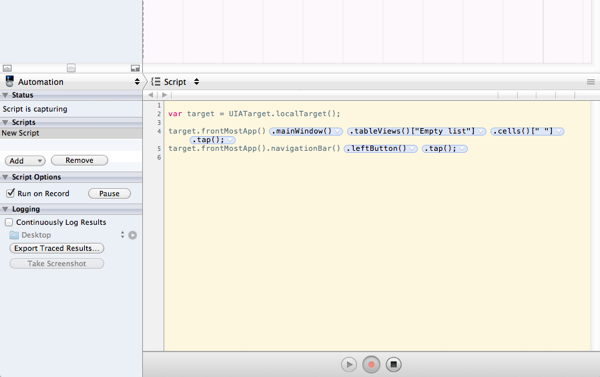
You’ll notice from the image above that you now have the ability to record, edit and run Javascript right from within the app! This makes exploring the possibilities much more fun and full of feedback than before. I would recommend still doing the bulk of your test organization in external files. You don’t want to have huge buckets of clutter that you have to maintain. But this script pane is great for the one off ideas.
Notice that you switch between the script and logging views by using the popup menu named “Script” above the main editor/logging pane.3
the script and logging panes. See in the sidebar under the “Status” section where it says “Script is Capturing”? Double click that and you’ll toggle between the two panes on the right. Don’t ask me how I found that out. WYSIWYG for the win, right? :)
You can manage scripts in the editing pane by clicking the “Add” and “Remove” buttons in the sidebar. Choosing “Create” from the “Add” menu just gives you a blank script to play with.
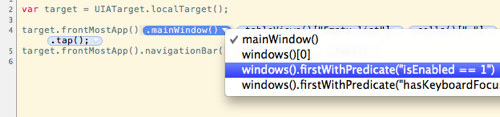
Recording is a little weird. You can click the red record button at the bottom to start. Then, when interacting with the simulator, the events are reproduced as those long, ugly Javascript lines. Each of the blue bubbles is a popup menu that lets you choose different ways of accessing that particular screen element like so:
In theory, it’s a pretty neat idea. It really helps while you’re exploring your application to see how best to automate it. But in practice, this is not how you’d want to organize your test suite for the long term. When you’ve got a lot of very common operations you want to perform, I argue that it’s better to encapsulate your screens as individual Javascript objects for you to interact with. This lets you build up a vocabulary of your own to reuse. Alas, I haven’t written part three of my tutorial yet where I explore this. For the moment, you’ll just have to take my word for it. :)
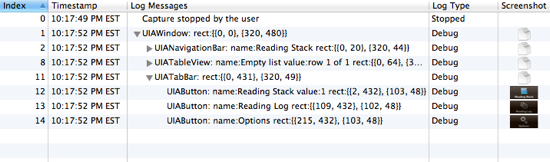
Finally we come to the log pane. You’ll notice that when logging an element tree we finally have a hierarchial representation! Much easier to read than before. And to the right we have screen captures of each of the individual elements that a line belongs to. Nice touch.
I like where this is going. Since Apple claims to be using UI Automation internally, there’s solid hope it will keep improving. It’s not quite ready for prime time use in a continuous integration flow, yet. The fact that it doesn’t return a proper Unix status code on failure is surprising. You could capture the output and grep for failure messages and handle that if you need to, but unfortunately that’s effort to solve a problem that shouldn’t exist.
Apple, you’ve built your empire on top of Unix. Don’t be afraid to do it the Unix way. :)
I plan to devote more attention to running instruments↩
Get a dictionary of environment variables in your app with [[NSProcessInfo processInfo] environment]↩
There’s also a quick shortcut to jump back and forth between↩
My books...